/ Posts / COVID19 - How Are We Doing?
by Owen Bott
on October 22, 2020
Where are we with COVID? How are we doing with testing and tracking? Are we managing to do a better job as a society to curb the spread of this virus? Let’s take a look into the data in a quick and easy way to form our own opinions.
DISCLAIMER – It is important to note that US states and territories report data in varying units and definitions. The values seen are simple sums of the data that states and territories have provided. Due to the disparate metrics, the values should be considered estimates.
In doing research and tracking down public data from various organizations, I was able to compile a few spreadsheets, either using APIs or directly loading in the files using Qlik’s data load editor to do some exploration.
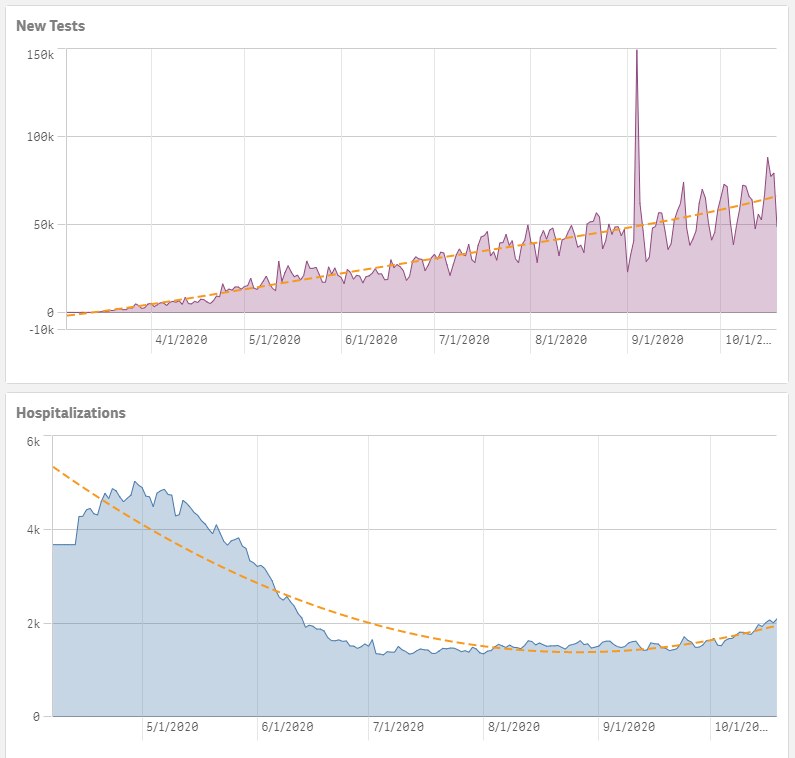
In Illinois (where I live), we can see that the number of new tests is going up as each day passes. The number of hospitalizations and deaths related to COVID are trending downwards, however they are still too high for comfort. With more individuals getting tested as the cold/flu season approaches, we would expect the amount of testing to increase and possibly the number of new cases to increase as well. When viewing the data, we can see just that. We can also see an interesting spike right around Sept 3rd. Why is that? Well, hard to say exactly, but being a Chicago native I some have tribunal knowledge and could tell you that everyone went down to the harbor to get out of the house and enjoy Labor Day weekend. @Chicagoans – was it worth it? Looking at the data, no. Although many people did decide to get tested, there was a huge spike in the number of new cases.
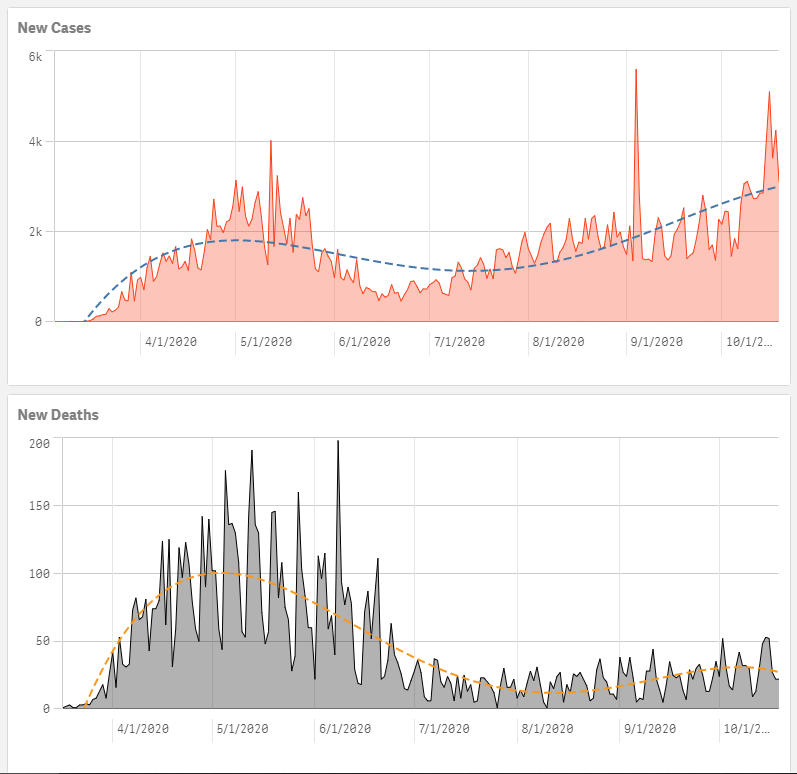
Although the number of new cases is increasing, we can have some solace in knowing that the number of deaths and hospitalizations are indeed declining in Illinois. What about the rest of the US?
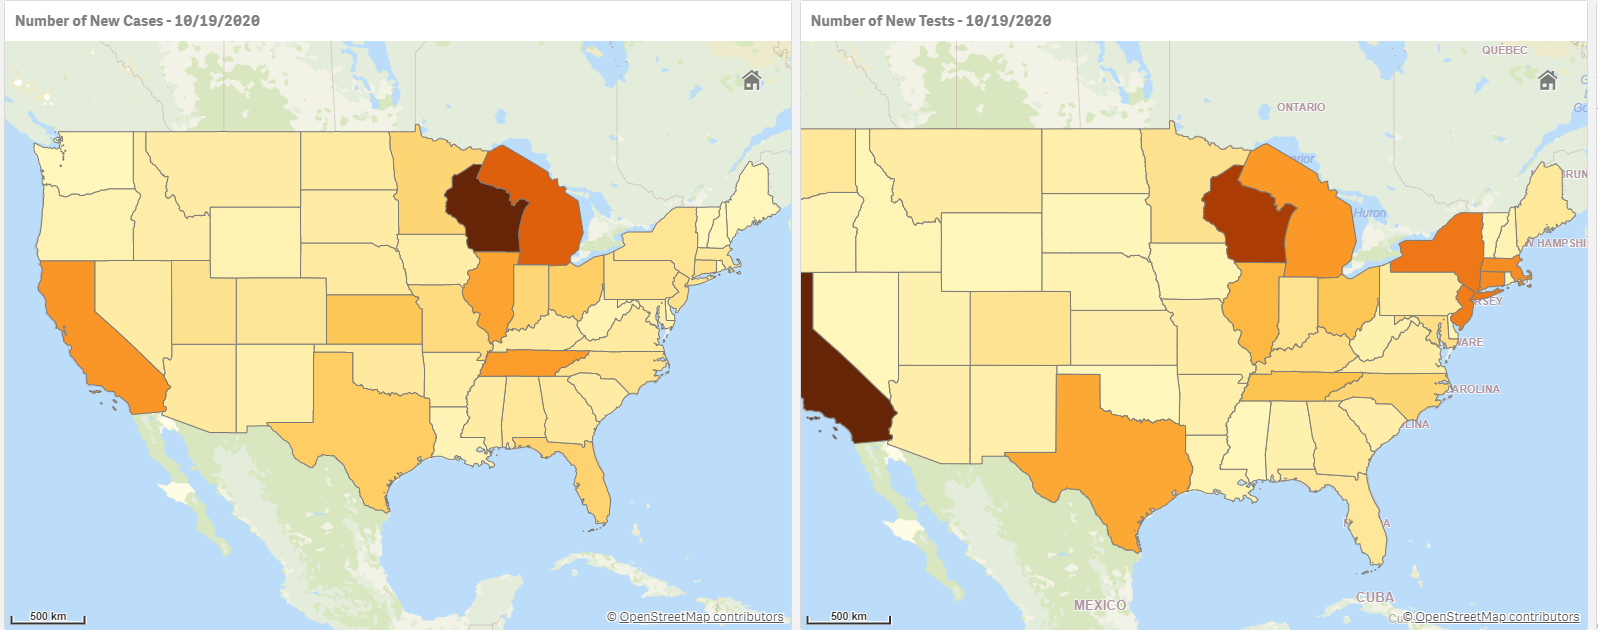
Looking at the map, we can see that the Midwest (Wisconsin and Michigan in particular) is witnessing a surge in the number of new cases in comparison to other regions. While the number of new tests is high in both Texas and the Upper Northeast area (including Boston, New York, etc.), the number of new positive cases is starting to settle down. Bravo to those areas that, according to the data, have learned to curb the spread of the virus.
By utilizing simple out of the box Qlik functionality, we are able to compile data from a multitude of sources and formats, create visualizations, apply trending, and formulate insights that allow us to tell a story to any audience. Now all we need is a vaccine!
For more information on this data or Qlik Sense, please contact a Pomerol Consultant today!
by Owen Bott on March 11, 2021
Pomerol Appoints New Partners - Scott Duthie & Goncalo Pereira
Viewby N/A - Dominick Amalraj on October 2, 2020
Learn how DataRobot can accelerate every aspect in the machine learning process
Viewby Owen Bott on October 1, 2020
What's New to Qlik Sense with the September 2020 Release
Viewby John Fitzgerald on August 31, 2020
A fire at a neighbor's house reminded me that the first attempt at solving a problem might not always be the right approach.
Viewby N/A - Tyler Robinson on August 18, 2020
How to take your Fantasy Football draft to the next level.
Viewby Scott Duthie on August 6, 2020
Data driven decision making starts at the branch – a case study for credit unions.
Viewby N/A - Dominick Amalraj on May 26, 2020
Elevate your organization from machine learning capable to machine learning driven.
Viewby N/A - Tyler Robinson on May 8, 2020
The Necessity for Clean Data - A Sample Use Case
Viewby Scott Duthie on May 6, 2020
4 Ways to extend Qlik NPrinting to get more value out of it.
Viewby Owen Bott on April 27, 2020
Sneak Peak into all of the new features in the Qlik Sense April 2020 Release
Viewby N/A - Brian McManamy on April 5, 2020
Are you getting the most out of your Qlik Sense monitoring tools?
Viewby N/A - Tyler Robinson on March 21, 2020
How can you use data to solve your most critical problems?
Viewby N/A - Dominick Amalraj on March 19, 2020
Learn more about how you can get the most out of your machine learning projects during unpredictable times
Viewby Wendell Truax on March 16, 2020
Plan your Qlik Sense upgrades more reliably with our extension inventory application.
Viewby Scott Duthie on March 1, 2020
How do you transform ‘Consumers’ of analytics to ‘Contributors’? You provide a tool for them to seamlessly share and communicate their questions, insights and ideas.
Viewby Scott Duthie on February 18, 2020
Explore the many ways that NodeGraph can help you track and manage your Qlik metadata.
Viewby Scott Duthie on January 8, 2020
Pomerol joins forces with non-profit to increase sex trafficking awareness through data analytics.
Viewby on January 8, 2020
Learn how Trifacta can simplify and expedite your data transformations for analysis.
Viewby on January 8, 2020
Check out the latest and greatest in the November 2019 Qlik Sense update.
Viewby N/A - Mike Mahoney on November 21, 2019
Learn about Motio and how version control is crucial for your Qlik deployment.
Viewby N/A - Mike Mahoney on November 21, 2019
Vizlib, a industry leading developer of Qlik Sense visualization extensions, has joined the Pomerol team.
Viewby on November 21, 2019
Pomerol Partners and Sense Excel collaborate to “turbo-charge” reporting and analysis for organizations
Viewby N/A - Mike Mahoney on November 21, 2019
What are the hot BI topics your organization should be thinking about?
Viewby N/A - Mike Mahoney on November 21, 2019
Couchbase and Pomerol Partners Drive Customer Success with Faster Time to Value
Viewby on November 21, 2019
We have partnered with StreamSets to help modernize your data integration efforts.
Viewby on November 21, 2019
Use these tips to build a self-service analytics platform for your organization.
Viewby on November 21, 2019
Qlik recently acquired CrunchBot and Crunch Data, an experienced AI and solution development team.
Viewby on November 21, 2019
Check out the new updates and functionalities of the Qlik Sense April 2019 Release.
Viewby Scott Duthie on November 21, 2019
Pomerol Partners and DataRobot to collaborate on automated machine learning within predictive analytics
Viewby on November 21, 2019
7 major roadblocks of machine learning projects and how to overcome them.
Viewby on November 21, 2019
Check out the new updates and functionalities for the Qlik Sense February 2019 Release.
Viewby on November 21, 2019
Check out the best updates and functionalities for the June 2019 Qlik Sense Release.
Viewby N/A - Mike Mahoney on October 16, 2019
Check out how the data wrangling tool, Trifacta, can help advance your machine learning needs.
Viewby Kanon Cozad on August 1, 2019
Learn about Big Squid and how Pomerol can help you implement it.
Viewby John Fitzgerald on December 25, 2016
Leverage K4 Analytics for advanced planning, budgeting, and forecasting from inside your Qlik apps
View